无监督学习是数据科学领域的关键分支,能够发现未标记数据的内在模式与联系,揭示数据背后的深层结构和本质。
接下来,我们将分享12个经典的无监督学习面试题,以助大家在面试准备上取得成功,并在日常工作中有效应用这些知识。
问题1
问题:描述unsupervised learning与supervised learning的主要区别。
Question: What are the main differences between unsupervised learning and supervised learning?
答案:
无监督学习(Unsupervised Learning)和监督学习(Supervised Learning)是机器学习中两个基本的学习范式,它们在目标、方法和应用场景上有着根本的区别。
在监督学习中,算法通过训练数据来学习,这些训练数据包含了输入和与之对应的输出(也称为标签)。算法的目标是学习出一个模型,能够对新的未见过的数据做出准确的预测或分类。这意味着,在监督学习中,每个训练样本都有一个明确的目标或结果,如图像识别中的标签(狗、猫等)或者在房价预测中的价格。
相比之下,无监督学习处理的是未标记的数据。这意味着训练数据不包含任何标签或者预定的输出结果。无监督学习的目标是探索数据本身的结构,发现数据中的模式、关系或者数据的分布特征。常见的无监督学习任务包括聚类、降维和关联规则学习。无监督学习在那些我们不知道输出结果,但希望通过数据揭示其内在结构和关系的场景中非常有用。
总的来说,监督学习侧重于通过已有的标签来预测结果,而无监督学习则致力于探索未标记数据中的模式和结构。
Answer:
Unsupervised Learning and Supervised Learning are two fundamental paradigms in machine learning, with fundamental differences in goals, methodologies, and application contexts.
In Supervised Learning, algorithms learn from training data, which includes inputs and their corresponding outputs (also known as labels). The goal is to learn a model that can make accurate predictions or classifications for new, unseen data. This means that each training sample in supervised learning has a clear target or outcome, such as labels in image recognition (dog, cat, etc.) or price in housing price predictions.
In contrast, Unsupervised Learning deals with unlabeled data. This means the training data do not contain any labels or predefined outputs. The goal of unsupervised learning is to explore the structure of the data itself, discovering patterns, relationships, or features of the data distribution. Common unsupervised learning tasks include clustering, dimensionality reduction, and association rule learning. Unsupervised learning is particularly useful in scenarios where the output is unknown, but there is a desire to uncover the inherent structure and relationships in the data.
In summary, Supervised Learning focuses on predicting outcomes using existing labels, while Unsupervised Learning is dedicated to exploring patterns and structures in unlabeled data.
问题2
问题:解释k-means聚类算法的工作原理。
Question: Explain how the k-means clustering algorithm works.
答案:
k-means聚类算法是一种广泛使用的无监督学习方法,用于将数据点分组成预定数量的聚类。算法的工作原理可以分为以下几个步骤:
- 计算每个数据点到各个聚类中心的距离,并将每个点分配到最近的聚类中心所代表的聚类。
- 重新计算每个聚类的中心,通常是聚类中所有点的均值。
- 重复步骤2和3,直到聚类中心的变化小于某个预设阈值,或者达到预定的迭代次数,此时算法结束。
Answer:
The k-means clustering algorithm is a widely used unsupervised learning method for grouping data points into a predefined number of clusters. The working principle of the algorithm can be summarized in the following steps:
- Randomly select k data points as the initial cluster centers.
- Calculate the distance of each data point to the cluster centers and assign each point to the cluster represented by the nearest center.
- Recalculate the centers of each cluster, usually as the mean of all points in the cluster.
- Repeat steps 2 and 3 until the change in cluster centers is less than a predetermined threshold, or a set number of iterations is reached, at which point the algorithm concludes.
问题3
问题:k-means聚类算法如何选择k的值?解释肘部法则。
Question: How does the k-means clustering algorithm choose the value of k? Explain the Elbow Method.
答案:
在k-means聚类算法中,选择合适的k值(聚类的数量)是至关重要的,因为它直接影响到聚类的效果。肘部法则(Elbow Method)是一种常用的方法,用来帮助确定最佳的k值。
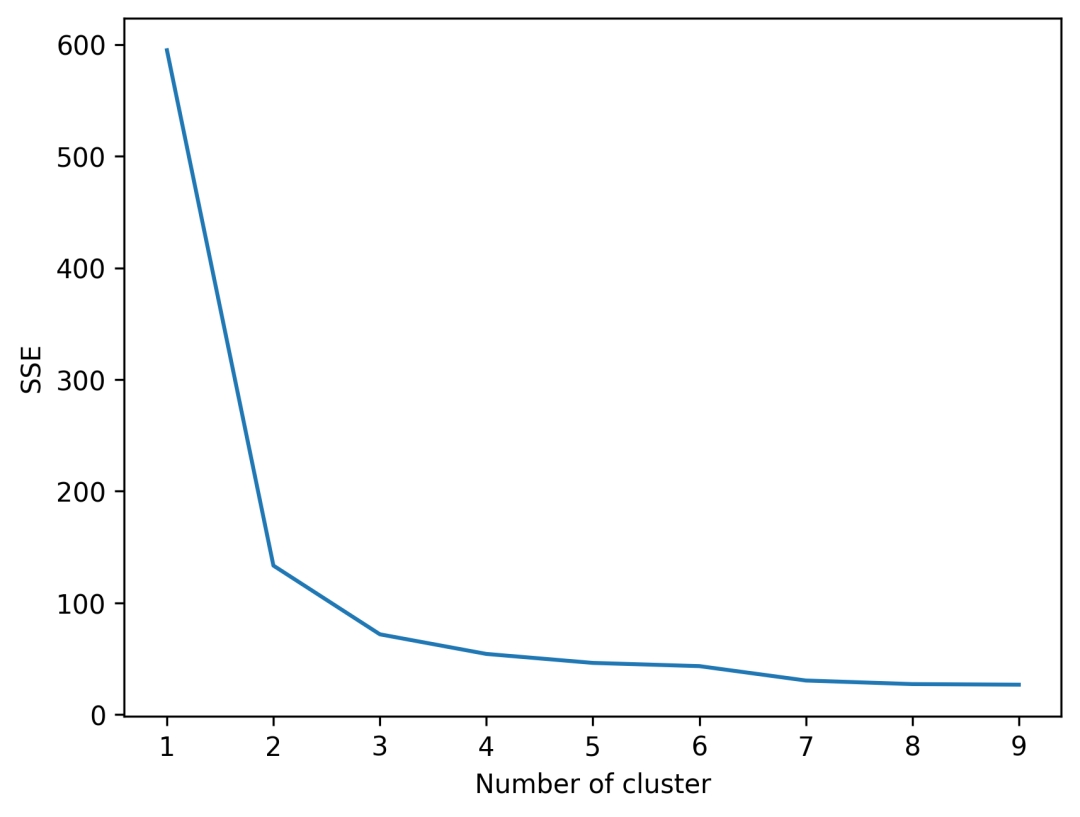
肘部法则的基本思想是对每个k值进行聚类,然后计算每个k值对应的聚类内误差平方和(SSE)。随着k值的增加,样本会更紧密地被分配到聚类中,因此SSE会逐渐减小。但是,在某个点之后,增加聚类数目(增大k值)带来的SSE减少量会显著下降,这个点就像肘部一样,因此被称为“肘点”。
通过绘制不同k值的SSE,我们可以观察到一个“弯曲”的点,这个点之前,SSE的下降很快;但在这个点之后,SSE的下降速度变慢。这个“弯曲”点就是肘部法则中的“肘点”,通常被认为是最佳的k值选择。
值得注意的是,肘部法则并不总是提供一个清晰且明确的“肘点”。在某些情况下,SSE下降曲线可能相对平滑,这时候选择k值就需要结合其他因素考虑,比如业务需求或其他聚类评估指标。
Answer:
In the k-means clustering algorithm, choosing the appropriate value of k (the number of clusters) is crucial because it directly affects the clustering outcome. The Elbow Method is a common technique used to determine the optimal value of k.
The basic idea of the Elbow Method is to perform clustering for each value of k and then calculate the Sum of Squared Errors (SSE) for each. As k increases, samples will be more tightly clustered, and thus the SSE will gradually decrease. However, after a certain point, the reduction in SSE will diminish significantly with an increase in the number of clusters (higher k values), resembling an "elbow".
By plotting the SSE for different values of k, we can observe a "bend" in the plot. Before this point, the SSE decreases sharply; after this point, the speed of the SSE decrease slows down. This "bend" is known as the "elbow" in the Elbow Method and is often considered the optimal choice for k.
It's important to note that the Elbow Method doesn't always provide a clear and definitive "elbow point". In some cases, the SSE decline curve may be relatively smooth, and the choice of k would need to consider other factors, such as business requirements or other clustering evaluation metrics.
import pandas as pd
from sklearn.datasets import load_iris
from sklearn.cluster import KMeans
import matplotlib.pyplot as plt

iris = load_iris()
X = pd.DataFrame(iris.data, columns=iris['feature_names'])
#print(X)
data = X[['sepal length (cm)', 'sepal width (cm)', 'petal length (cm)']]

sse = {}
for k in range(1, 10):
    kmeans = KMeans(n_clusters=k, max_iter=1000).fit(data)
    data["clusters"] = kmeans.labels_
    #print(data["clusters"])
    sse[k] = kmeans.inertia_ # Inertia: Sum of distances of samples to their closest cluster center

plt.figure(dpi=300)
plt.plot(list(sse.keys()), list(sse.values()))
plt.xlabel("Number of cluster")
plt.ylabel("SSE")
plt.show()
问题4
问题:k-means聚类算法如何选择k的值?解释silhouette系数。
Question: How does the k-means clustering algorithm choose the value of k? Explain the silhouette coefficient.
答案:
在k-means聚类算法中,选择合适的k值(即聚类的数量)对于获得有意义的聚类结果非常关键。除了肘部法则之外,silhouette系数也是一种常用来确定最佳k值的方法。
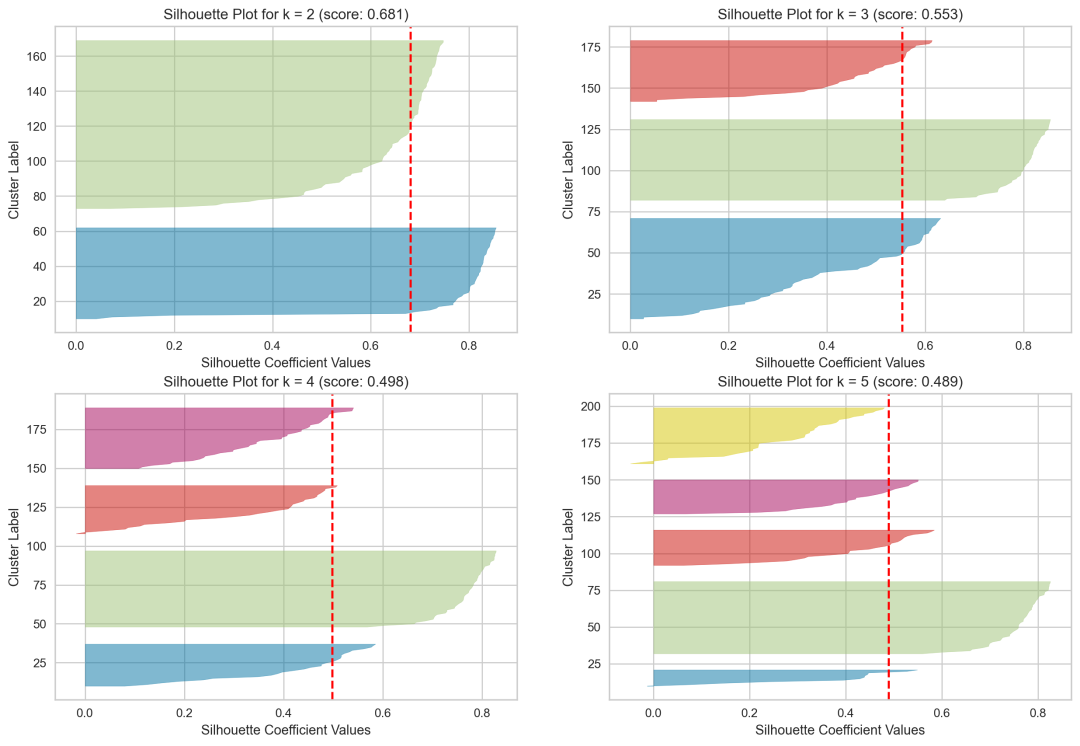
Silhouette系数是衡量聚类效果好坏的一个指标,其值的范围从-1到1。Silhouette系数高意味着聚类内的样本相对更紧密,而聚类间的样本相对更分散,这表明聚类结果较好。计算一个样本的Silhouette系数时,会用到以下两个量:a是该样本与同聚类中其他样本的平均距离;b是该样本与最近的另一个聚类中所有样本的平均距离。Silhouette系数通过公式
来计算。选择k值的一个常用方法是:对于不同的k值,计算聚类结果的平均Silhouette系数,然后选择平均Silhouette系数最高的k值。平均Silhouette系数越高,表示聚类效果越好。
需要注意的是,尽管Silhouette系数提供了一种量化聚类质量的方式,但它也有局限性。在某些数据集中,最高的Silhouette系数可能对应的聚类结果并不一定符合我们的预期或实际应用需求。因此,在实际中选择k值时,还需要考虑数据的特性和业务背景。
Answer:
In the k-means clustering algorithm, choosing the appropriate value of k (the number of clusters) is crucial for achieving meaningful clustering outcomes. Apart from the Elbow Method, the silhouette coefficient is another commonly used method to determine the optimal value of k.
The silhouette coefficient is a measure of how good a clustering result is, with its value ranging from -1 to 1. A high silhouette coefficient means that the samples within a cluster are relatively closer to each other, and the samples across different clusters are more dispersed, indicating a better clustering result. The silhouette coefficient for a sample is calculated using two quantities: (a), the average distance of the sample to the other samples in the same cluster, and (b), the average distance of the sample to all samples in the nearest other cluster. The silhouette coefficient is then calculated using the formula
.A common approach to choosing k is to calculate the average silhouette coefficient for clustering results with different values of k and then select the k value that yields the highest average silhouette coefficient. The higher the average silhouette coefficient, the better the clustering result.
It's important to note that while the silhouette coefficient provides a way to quantify the quality of clustering, it also has limitations. In some datasets, the highest silhouette coefficient may not necessarily correspond to a clustering result that meets our expectations or practical application needs. Therefore, when choosing k, the characteristics of the data and the context of the application should also be considered.
#!pip install yellowbrick
import matplotlib.pyplot as plt
from sklearn.cluster import KMeans
from sklearn.metrics import silhouette_score
from yellowbrick.cluster import SilhouetteVisualizer
from sklearn.datasets import load_iris

iris = load_iris()
data = iris.data

fig, ax = plt.subplots(2, 2, figsize=(15, 10), dpi=200)

# Store silhouette scores in a dictionary for later use
silhouette_scores = {}

for i, k in enumerate([2, 3, 4, 5], start=1):
    km = KMeans(n_clusters=k, init='k-means++', n_init=10, max_iter=100, random_state=0)
    q, mod = divmod(i - 1, 2)

    visualizer = SilhouetteVisualizer(km, colors='yellowbrick', ax=ax[q][mod])
    visualizer.fit(data)

    silhouette_avg = silhouette_score(data, visualizer.labels_,  metric='euclidean')
    silhouette_scores[k] = silhouette_avg

    # Print the silhouette score for the current number of clusters
    print(f"Silhouette Score for k = {k}: {silhouette_avg}")

     # Set x and y labels for each subplot
    ax[q][mod].set_xlabel('Silhouette Coefficient Values')
    ax[q][mod].set_ylabel('Cluster Label')

    # Set title to include the silhouette score
    ax[q][mod].set_title(f'Silhouette Plot for k = {k} (score: {silhouette_avg:.3f})')

plt.show()
Silhouette Score for k = 2: 0.6810461692117462
Silhouette Score for k = 3: 0.5528190123564095
Silhouette Score for k = 4: 0.49805050499728737
Silhouette Score for k = 5: 0.48874888709310566
问题5
问题:在进行聚类之前,为什么数据标准化很重要?它是如何影响聚类结果的?
Question: Why is data normalization important before clustering? How does it affect the clustering results?
答案:
在进行聚类之前,数据标准化是一个重要的预处理步骤,因为它直接影响到聚类算法的性能和结果。数据标准化涉及到将所有特征缩放到统一的范围内,常见的方法有最大最小归一化和Z分数归一化(即标准化)。
不同特征的量纲和数值范围差异可能导致聚类算法过分强调数值范围大的特征。例如,在K-Means聚类中,算法基于欧氏距离来计算数据点之间的相似度。如果数据未经标准化,那么数值范围较大的特征会对距离计算产生较大影响,从而影响聚类的结果。
标准化后的数据能够确保每个特征对最终聚类结果的贡献度是均衡的。这样,算法就能够更加公平地评估数据点之间的相似度或距离,从而获得更加准确和有意义的聚类结果。
总之,数据标准化通过消除量纲影响和数值范围的差异,提高了聚类分析的准确性和可靠性。在实际应用中,适当的数据预处理是获得有效聚类结果的关键步骤。
Answer:
Data normalization is a crucial preprocessing step before clustering because it directly impacts the performance and outcomes of clustering algorithms. Data normalization involves scaling all features to a uniform range, with common methods including min-max normalization and Z-score normalization (standardization).
Differences in scale and value range of features can lead to clustering algorithms disproportionately emphasizing features with larger ranges. For instance, in K-Means clustering, the algorithm calculates the similarity between data points based on the Euclidean distance. Without normalization, features with larger numerical ranges will have a greater impact on distance calculations, thereby affecting the clustering outcomes.
Normalized data ensures that each feature contributes equally to the final clustering results. Thus, the algorithm can more fairly evaluate the similarity or distance between data points, leading to more accurate and meaningful clustering outcomes.
In summary, data normalization, by eliminating the influence of units and differences in numerical ranges, enhances the accuracy and reliability of cluster analysis. In practice, appropriate data preprocessing is a key step to obtaining effective clustering results.
from sklearn.preprocessing import StandardScaler

scaler = StandardScaler()
data_scaled = scaler.fit_transform(data)
问题6
问题:解释异常值对k-means聚类的影响,并讨论如何处理这种情况。
Question: Explain the impact of outliers on k-means clustering and discuss how to deal with them.
答案:
异常值是那些与大多数数据点显著不同的数据点。在k-means聚类中,异常值的存在会对聚类结果产生显著影响,原因如下:
影响聚类中心的计算:由于k-means聚类是基于最小化每个点到其聚类中心的欧氏距离之和,异常值由于其极端的值会拉远聚类中心,从而可能导致聚类中心不准确地反映大多数数据点的位置。
影响聚类的质量:异常值可能导致聚类边界不准确,使得原本应该属于同一聚类的数据点被错误地分配到其他聚类,降低了聚类的准确性和可解释性。
处理异常值的策略包括:
- 数据清洗:在进行聚类之前,通过统计分析方法(如箱型图)识别并移除异常值。
- 稳健的聚类算法:选择对异常值不敏感的聚类算法,如DBSCAN,它可以识别并处理异常值。
- 数据转换:应用数据转换方法(如对数转换)来减少异常值的影响。
- 异常值检测和处理:使用异常值检测算法(如基于Z-score或IQR方法)先识别异常值,然后决定如何处理它们,比如通过限制它们的影响或将它们从数据集中删除。
综上所述,合理处理异常值对于提高k-means聚类算法的效果至关重要。
Answer:
Outliers are data points that are significantly different from most other data points. In k-means clustering, the presence of outliers can significantly impact the clustering results for the following reasons:
Affects the calculation of cluster centers: Since k-means clustering aims to minimize the sum of the Euclidean distances from each point to its cluster center, outliers, due to their extreme values, can pull the cluster center away, potentially causing the cluster center to inaccurately reflect the position of the majority of data points.
Impacts the quality of clustering: Outliers can lead to inaccurate clustering boundaries, causing data points that should belong to the same cluster to be wrongly assigned to other clusters, reducing the accuracy and interpretability of the clustering.
Strategies to deal with outliers include:
- Data cleaning: Identify and remove outliers before clustering using statistical analysis methods, such as box plots.
- Robust clustering algorithms: Choose clustering algorithms that are insensitive to outliers, like DBSCAN, which can identify and handle outliers.
- Data transformation: Apply data transformation methods (e.g., logarithmic transformation) to reduce the impact of outliers.
- Outlier detection and handling: Use outlier detection algorithms (such as based on Z-score or IQR methods) to identify outliers, then decide how to deal with them, whether by mitigating their impact or removing them from the dataset.
In summary, appropriately dealing with outliers is crucial for improving the effectiveness of the k-means clustering algorithm.
问题7
问题:在什么情况下你会选择使用DBSCAN聚类算法而不是k-means?
Question: Under what circumstances would you choose the DBSCAN clustering algorithm over k-means?
答案:
DBSCAN(Density-Based Spatial Clustering of Applications with Noise)是一种基于密度的聚类算法,与k-means算法相比,有其独特的优势和适用场景:
数据集含有异常值:DBSCAN对异常值具有很好的鲁棒性。它能够识别并处理噪声点,这些噪声点不会被划分到任何聚类中,而k-means由于是基于距离的方法,异常值会影响聚类中心的计算。
聚类形状的多样性:当数据集中的聚类形状不仅仅是球形时,DBSCAN能够识别任意形状的聚类,因为它是基于密度的聚类,而k-means则假设聚类是球形,对于非球形聚类的识别能力有限。
聚类数量未知:DBSCAN不需要事先指定聚类的数量,它通过密度连接的概念自动确定聚类的数量。相反,k-means需要预先设定聚类的数量k,这在不了解数据集特性的情况下可能难以确定。
数据集的规模和密度差异大:DBSCAN能够很好地处理规模和密度差异大的数据集,因为它通过局部密度估计来形成聚类,而k-means在处理规模和密度差异大的数据集时可能不会得到满意的聚类结果。
综上所述,当数据集含有异常值、聚类形状多样、聚类数量未知或数据集的规模和密度差异大时,选择DBSCAN聚类算法而不是k-means将更为合适。
Answer:
DBSCAN (Density-Based Spatial Clustering of Applications with Noise) is a density-based clustering algorithm that, compared to the k-means algorithm, has unique advantages and suitable scenarios:
Presence of outliers in the dataset: DBSCAN has good robustness to outliers. It can identify and deal with noise points, which are not assigned to any cluster, whereas k-means, being a distance-based method, can have its cluster centers affected by outliers.
Diversity in cluster shapes: DBSCAN can identify clusters of arbitrary shapes within the dataset because it is a density-based clustering method, while k-means assumes clusters are spherical and has limited capability in recognizing non-spherical clusters.
Unknown number of clusters: DBSCAN does not require specifying the number of clusters in advance. It determines the number of clusters automatically through the concept of density connectivity. On the other hand, k-means requires setting the number of clusters (k) beforehand, which might be difficult without prior knowledge of the dataset.
Large variations in scale and density of the dataset: DBSCAN can effectively handle datasets with large variations in scale and density because it forms clusters based on local density estimation, whereas k-means might not yield satisfactory clustering results for datasets with large variations in scale and density.
In summary, DBSCAN is more suitable than k-means when the dataset contains outliers, has diverse cluster shapes, the number of clusters is unknown, or there are large variations in scale and density within the dataset.
问题8
问题:在unsupervised learning中,如何评估聚类模型的性能?
Question: How do you evaluate the performance of a clustering model in unsupervised learning?
答案:
在unsupervised learning中,由于缺乏明确的标签来验证聚类的准确性,评估聚类模型的性能需要采用不同的方法。这些方法主要分为两大类:内部评估方法和外部评估方法。
内部评估方法主要通过分析聚类结果的内在结构来评估性能。
- 轮廓系数(Silhouette Coefficient):衡量聚类内部的紧密程度与聚类间的分离程度。值的范围在-1到1之间,值越大表示聚类效果越好。
外部评估方法需要额外的信息来评估聚类效果,通常是与预先定义的基准或真实标签进行比较。
- 相互信息(Mutual Information, MI):衡量聚类结果和真实标签之间的共享信息量。值越高,表示聚类结果与真实情况的一致性越好。
选择合适的评估方法取决于具体的应用场景和可用的信息。在没有外部标签的情况下,通常采用内部评估方法来判断聚类的质量和有效性。
Answer:
In unsupervised learning, due to the absence of explicit labels to verify the accuracy of clusters, evaluating the performance of a clustering model requires different approaches. These methods are mainly divided into two categories: internal evaluation methods and external evaluation methods.
Internal evaluation methods assess performance by analyzing the internal structure of the clustering results.
- Silhouette Coefficient: Measures the tightness within clusters and the separation between clusters. Its values range from -1 to 1, with higher values indicating better clustering.
External evaluation methods require additional information to assess the effectiveness of clustering, typically comparing it with predefined benchmarks or true labels.
- Mutual Information (MI): Measures the amount of shared information between the clustering results and true labels. Higher values indicate better consistency between clustering results and reality.
Choosing the appropriate evaluation method depends on the specific application context and available information. In the absence of external labels, internal evaluation methods are typically used to judge the quality and effectiveness of clustering.
问题9
问题:对于高维数据,unsupervised learning面临哪些挑战?你会如何解决这些挑战?
Question: What challenges does unsupervised learning face with high-dimensional data? How would you address these challenges?
答案:
对于高维数据,unsupervised learning面临几个主要挑战:
维度灾难:随着数据维度的增加,数据点之间的距离变得越来越相似,这会导致传统的基于距离的聚类算法(如k-means)效果下降。在高维空间中,所有数据点几乎等距离分布,使得区分不同聚类变得困难。
可解释性降低:高维数据往往难以可视化,这限制了我们理解数据结构和聚类结果的能力。由于无法直观展示高维空间,解释和验证聚类结果变得更加挑战。
计算复杂度增加:高维度意味着更多的计算资源消耗。许多unsupervised learning算法的计算复杂度会随着维度的增加而显著增加,导致计算时间变长,对资源的需求增加。
为了解决这些挑战,可以采取以下策略:
降维技术:使用降维技术(如PCA、t-SNE、或Autoencoders)减少数据的维度,同时尽量保留原始数据的关键信息。这不仅可以缓解维度灾难问题,还可以提高聚类算法的效率和效果。
稀疏性考虑:对于稀疏的高维数据,选择或开发专门处理稀疏数据的unsupervised learning算法。这类算法能够更有效地处理高维空间中的稀疏性问题。
特征选择:通过特征选择方法,识别并保留对聚类最有信息量的特征,同时去除噪声或不相关的特征。这有助于减少维度并提高聚类的质量和可解释性。
使用更复杂的模型:考虑使用更加复杂的unsupervised learning模型,如基于密度的聚类算法(DBSCAN)或基于图的聚类算法(谱聚类),这些算法可能对高维数据的聚类有更好的性能。
综上所述,通过合理的数据预处理、降维、和选择合适的算法,可以有效地应对高维数据在unsupervised learning中面临的挑战。
Answer:
Unsupervised learning faces several key challenges with high-dimensional data:
Curse of dimensionality: As the dimensionality of the data increases, the distance between data points becomes more uniform, which can degrade the performance of traditional distance-based clustering algorithms (such as k-means). In high-dimensional spaces, all data points are almost equidistantly distributed, making it difficult to distinguish between different clusters.
Reduced interpretability: High-dimensional data are often hard to visualize, which limits our ability to understand the data structure and clustering results. The inability to visually present high-dimensional spaces adds challenges to explaining and validating the clustering outcomes.
Increased computational complexity: Higher dimensions mean more computational resources are consumed. The computational complexity of many unsupervised learning algorithms significantly increases with the dimensionality, leading to longer computation times and increased resource demands.
To address these challenges, the following strategies can be adopted:
Dimensionality reduction techniques: Use dimensionality reduction techniques (such as PCA, t-SNE, or Autoencoders) to reduce the dimensions of the data while retaining the key information of the original data as much as possible. This can mitigate the curse of dimensionality and improve the efficiency and effectiveness of clustering algorithms.
Consideration of sparsity: For sparse high-dimensional data, choose or develop unsupervised learning algorithms specifically designed to handle sparse data. These algorithms can more effectively deal with sparsity issues in high-dimensional spaces.
Feature selection: Identify and retain the most informative features for clustering through feature selection methods while removing noise or irrelevant features. This helps reduce dimensions and improve the quality and interpretability of clustering.
Use more complex models: Consider using more complex unsupervised learning models, such as density-based clustering algorithms (DBSCAN) or graph-based clustering algorithms (spectral clustering), which may perform better in clustering high-dimensional data.
In summary, by appropriately preprocessing data, reducing dimensions, and selecting suitable algorithms, the challenges faced by high-dimensional data in unsupervised learning can be effectively addressed.
问题10
问题:如何利用unsupervised learning来进行客户细分?
Question: How can unsupervised learning be used for customer segmentation?
答案:
利用unsupervised learning进行客户细分是一种有效的方法,可以帮助企业理解客户的行为模式,从而为不同类型的客户提供个性化的服务或产品。以下是实现过程中的关键步骤:
数据收集与预处理:首先,收集关于客户的各种数据,包括但不限于购买历史、用户行为数据、社交媒体互动等。然后,进行必要的数据清洗和预处理工作,如处理缺失值、异常值以及进行特征工程等。
选择合适的聚类算法:根据数据的特性和业务需求,选择适合的unsupervised learning算法。常用的算法包括K-means、层次聚类(Hierarchical Clustering)、DBSCAN等。K-means因其简单高效而广泛用于客户细分。
确定聚类数量:对于某些算法如K-means,需要预先指定聚类的数量。可以使用肘部法则(Elbow Method)或轮廓系数(Silhouette Coefficient)等方法来估计最佳聚类数量。
模型训练与聚类:使用选定的算法对数据进行聚类。这一步骤会将客户分成几个不同的群体,每个群体内部的客户具有相似的特征。
分析聚类结果:分析每个聚类群体的特征,理解不同群体的特点和需求。这可能涉及到查看每个群体的统计数据,进行维度降低和数据可视化,以及与业务知识结合来解释聚类结果。
应用于业务决策:根据聚类结果,企业可以针对不同客户群体制定个性化的营销策略、产品开发或服务改进计划。这有助于提升客户满意度和企业的市场竞争力。
通过以上步骤,unsupervised learning使得客户细分变得更加科学和精确,为企业提供了深入理解客户群体的新视角。
Answer:
Using unsupervised learning for customer segmentation is an effective way to help businesses understand customer behavior patterns, thereby offering personalized services or products to different types of customers. Here are the key steps in the process:
Data Collection and Preprocessing: First, collect various data about customers, including but not limited to purchase history, user behavior data, and social media interactions. Then, perform necessary data cleaning and preprocessing, such as dealing with missing values, outliers, and feature engineering.
Choose an Appropriate Clustering Algorithm: Based on the characteristics of the data and business needs, select a suitable unsupervised learning algorithm. Common algorithms include K-means, Hierarchical Clustering, and DBSCAN. K-means is widely used for customer segmentation due to its simplicity and efficiency.
Determine the Number of Clusters: For some algorithms like K-means, it is required to specify the number of clusters in advance. Methods such as the Elbow Method or Silhouette Coefficient can be used to estimate the optimal number of clusters.
Model Training and Clustering: Cluster the data using the chosen algorithm. This step divides customers into several different groups, with customers within each group sharing similar characteristics.
Analyze Clustering Results: Analyze the characteristics of each cluster group to understand the features and needs of different groups. This may involve looking at statistical data for each group, performing dimensionality reduction and data visualization, and combining with business knowledge to interpret the clustering results.
Apply to Business Decisions: Based on the clustering results, businesses can develop personalized marketing strategies, product development, or service improvement plans for different customer groups. This helps to enhance customer satisfaction and the market competitiveness of the business.
Through these steps, unsupervised learning makes customer segmentation more scientific and precise, providing businesses with new insights into understanding customer groups.
问题11
问题:解释层次聚类和k-means聚类的区别。
Question: Explain the differences between hierarchical clustering and k-means clustering.
答案:
层次聚类(Hierarchical Clustering)和k-means聚类是两种常用的聚类方法,它们在聚类过程和结果的解释上有明显的区别:
- 层次聚类:不需要预先指定聚类数量。它通过逐步合并(凝聚层次聚类)或分裂(分裂层次聚类)数据点来构建一个聚类层次,形成一个树状的聚类结构,称为聚类树或层次树。通过剪枝聚类树,可以在不同的层次上观察数据的聚类。
- k-means聚类:需要预先指定聚类的数量(k值)。算法通过迭代优化过程,将数据点分配到k个聚类中,使得每个聚类内的点与聚类中心的距离之和最小。
- 层次聚类:结果是一个层次树,提供了丰富的层次结构信息,可以根据需要选择不同层次的聚类划分。这使得层次聚类在理解数据结构和关系上更为灵活和深入。
- k-means聚类:结果是将数据划分为k个聚类,每个聚类由一个聚类中心代表。k-means更适用于寻找球形或近似球形的聚类,且聚类数量需要提前确定。
- 层次聚类:适用于小到中等规模的数据集,尤其是当聚类结构可能具有嵌套或层次特性时。但是,层次聚类的计算复杂度较高,不适合大规模数据集。
- k-means聚类:适用于大规模数据集,因为它相对于层次聚类有更高的计算效率。但k-means可能对初始聚类中心的选择敏感,并且假设聚类具有相似的方差。
总的来说,层次聚类和k-means聚类各有优势和局限,选择哪种方法取决于数据的特性、聚类的目的以及计算资源的可用性。
Answer:
Hierarchical clustering and k-means clustering are two popular clustering methods, and they have distinct differences in their clustering processes and the interpretation of their results:
- Hierarchical Clustering: Does not require the number of clusters to be specified in advance. It builds a hierarchy of clusters by progressively merging (agglomerative hierarchical clustering) or splitting (divisive hierarchical clustering) data points, forming a tree-like structure of clusters, known as a dendrogram. By cutting the dendrogram, clusters can be obtained at different levels.
- K-means Clustering: Requires the number of clusters (k) to be specified beforehand. The algorithm assigns data points to k clusters through an iterative optimization process, minimizing the sum of distances between points and their cluster centers.
- Hierarchical Clustering: The result is a dendrogram that provides rich hierarchical information, allowing for flexible selection of cluster divisions at different levels. This makes hierarchical clustering more flexible and insightful in understanding the structure and relationships in the data.
- K-means Clustering: The result is the division of data into k clusters, each represented by a cluster center. K-means is more suitable for identifying spherical or near-spherical clusters and requires a predetermined number of clusters.
Applicability and Efficiency:
- Hierarchical Clustering: Suitable for small to medium-sized datasets, especially when the clustering structure might have nested or hierarchical characteristics. However, hierarchical clustering has a higher computational complexity and is not suited for large-scale datasets.
- K-means Clustering: Suitable for large datasets due to its higher computational efficiency compared to hierarchical clustering. However, k-means can be sensitive to the selection of initial cluster centers and assumes clusters have similar variances.
In summary, hierarchical clustering and k-means clustering each have their advantages and limitations, and the choice between them depends on the characteristics of the data, the objectives of clustering, and the availability of computational resources.
问题12
问题:DBSCAN模型有哪几个重要的参数?
Question: What are the key parameters of the DBSCAN model?
答案:
DBSCAN(Density-Based Spatial Clustering of Applications with Noise)模型是一种基于密度的聚类算法,其核心思想是根据密度的连续性来划分聚类。在DBSCAN算法中,有两个非常关键的参数:
半径(ε):这个参数定义了一个点的邻域的大小,即在这个半径范围内的所有点都被认为是该点的邻居。通过调整ε的值,可以控制聚类的紧密程度,较小的ε值会导致更多的聚类,而较大的ε值可能会导致聚类合并。
最小点数(MinPts):这个参数定义了一个点成为核心点(即该点的邻域内至少有MinPts个点,包括该点本身)所需的最小邻居数目。核心点是形成聚类的基础。MinPts的值决定了算法对噪声的敏感度,较大的MinPts值能够减少噪声点的影响,但同时也可能导致少数点被划分为噪声。
这两个参数共同决定了DBSCAN算法能够识别的聚类的密度和形状。选择合适的ε和MinPts值是DBSCAN聚类成功的关键。通常,这需要根据具体的数据集和应用场景进行调整和尝试。一种常用的方法是基于k-距离图来选择一个合适的ε值,其中k等于MinPts-1。该图可以帮助识别ε的合理值,从而为DBSCAN聚类提供一个好的起点。
Answer:
The DBSCAN (Density-Based Spatial Clustering of Applications with Noise) model is a density-based clustering algorithm, which fundamentally relies on the continuity of density to form clusters. There are two critical parameters in the DBSCAN algorithm:
Epsilon (ε): This parameter defines the size of a point's neighborhood, i.e., all points within this radius are considered neighbors of that point. Adjusting the value of ε controls the compactness of the clustering; a smaller ε value leads to more clusters, while a larger ε value may result in clusters merging together.
Minimum Points (MinPts): This parameter defines the minimum number of neighbors a point needs to have to be considered a core point (i.e., there are at least MinPts points within its ε-neighborhood, including the point itself). Core points are essential for forming clusters. The value of MinPts determines the algorithm's sensitivity to noise; a larger MinPts value can reduce the impact of noise points but may also lead to fewer points being classified as part of a cluster.
These two parameters together determine the density and shape of the clusters that the DBSCAN algorithm can identify. Choosing appropriate values for ε and MinPts is key to the success of DBSCAN clustering. Typically, this requires adjustment and experimentation based on the specific dataset and application context. A common method for selecting a suitable ε value is based on the k-distance plot, where k equals MinPts-1. This graph can help identify a reasonable value for ε, providing a good starting point for DBSCAN clustering.

